I went looking for sustainable products and found a data problem
How a 2024 search for trustworthy eco-friendly products became two years of learning about EPDs, LCA, carbon data and the concept built around the gap.
By Writam Bugga · · 3 min read
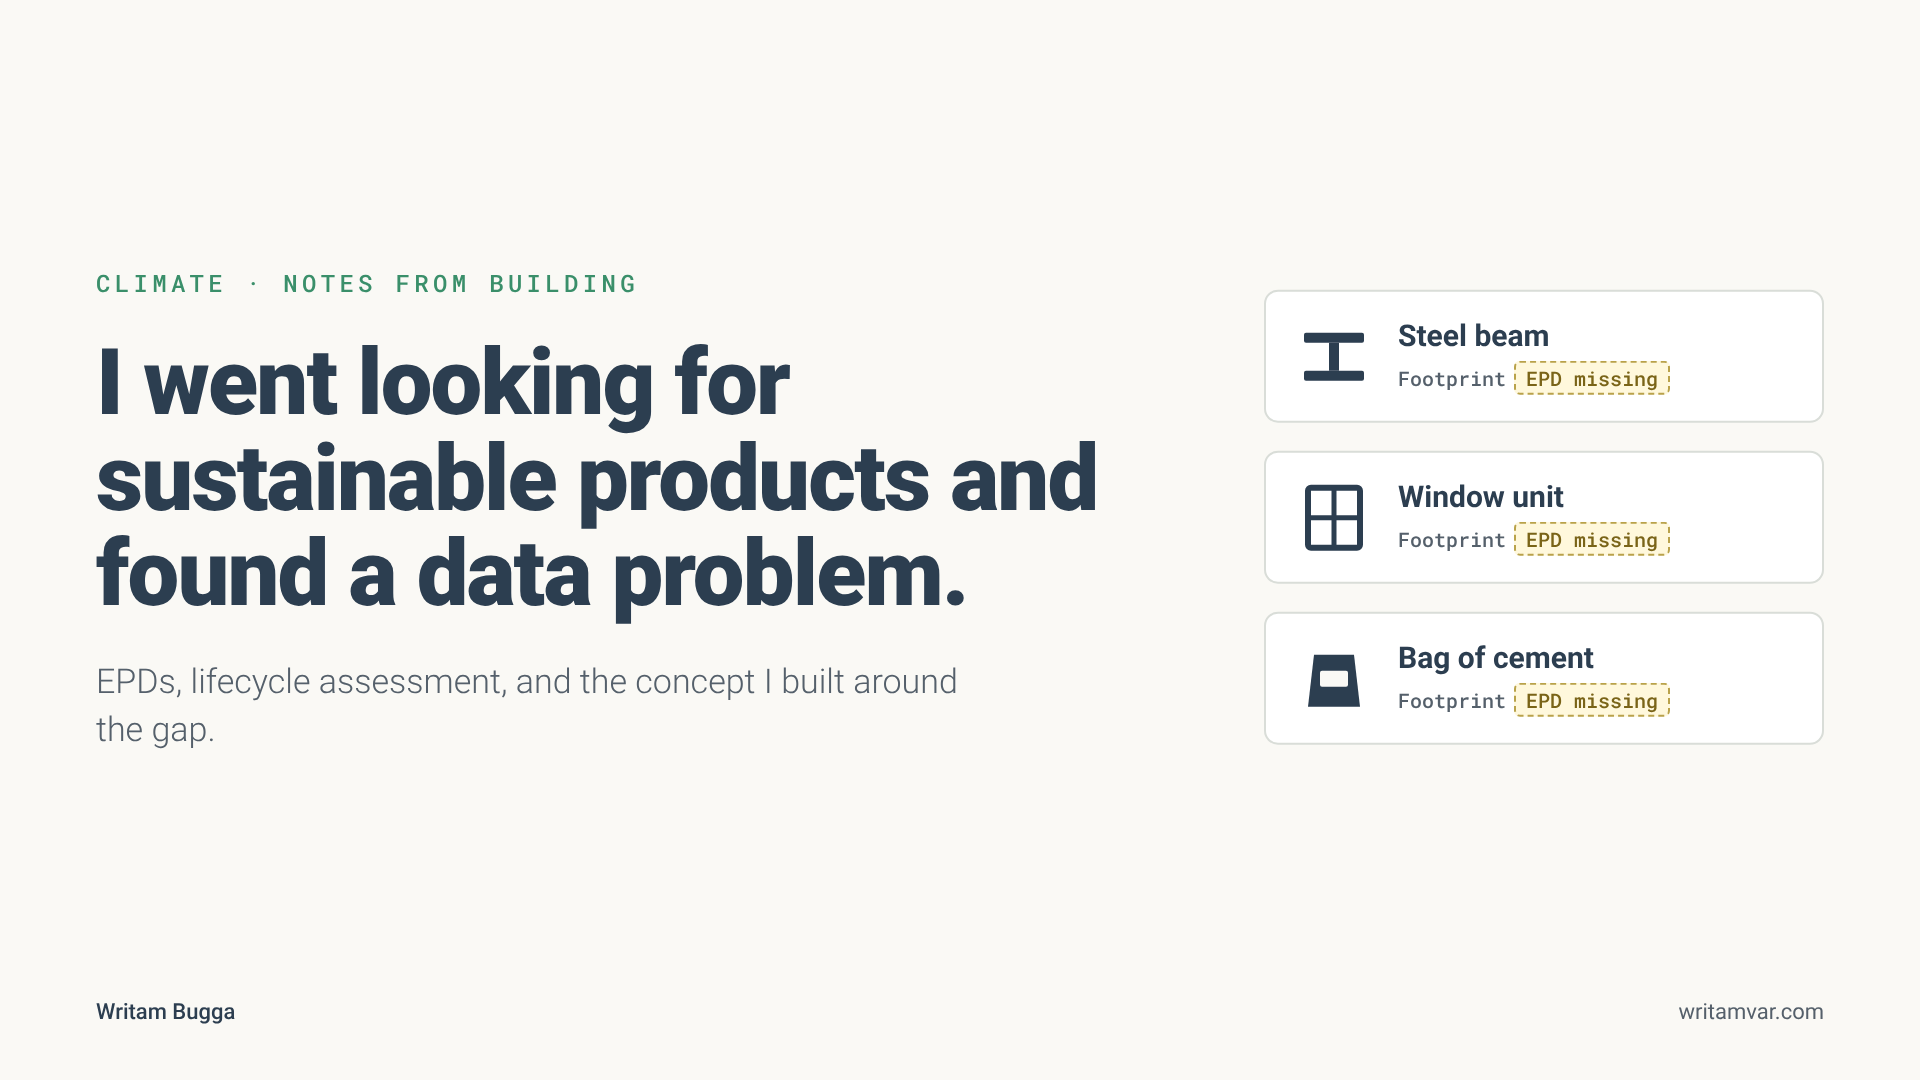
In 2024 I started looking for eco-friendly products. I began with India, the most populous country in the world, where what people buy turns into a lot of waste. I could not find one marketplace or source I trusted. That search turned into two years of learning about carbon data. This is what I mapped, the questions I kept asking and the concept I built from it.
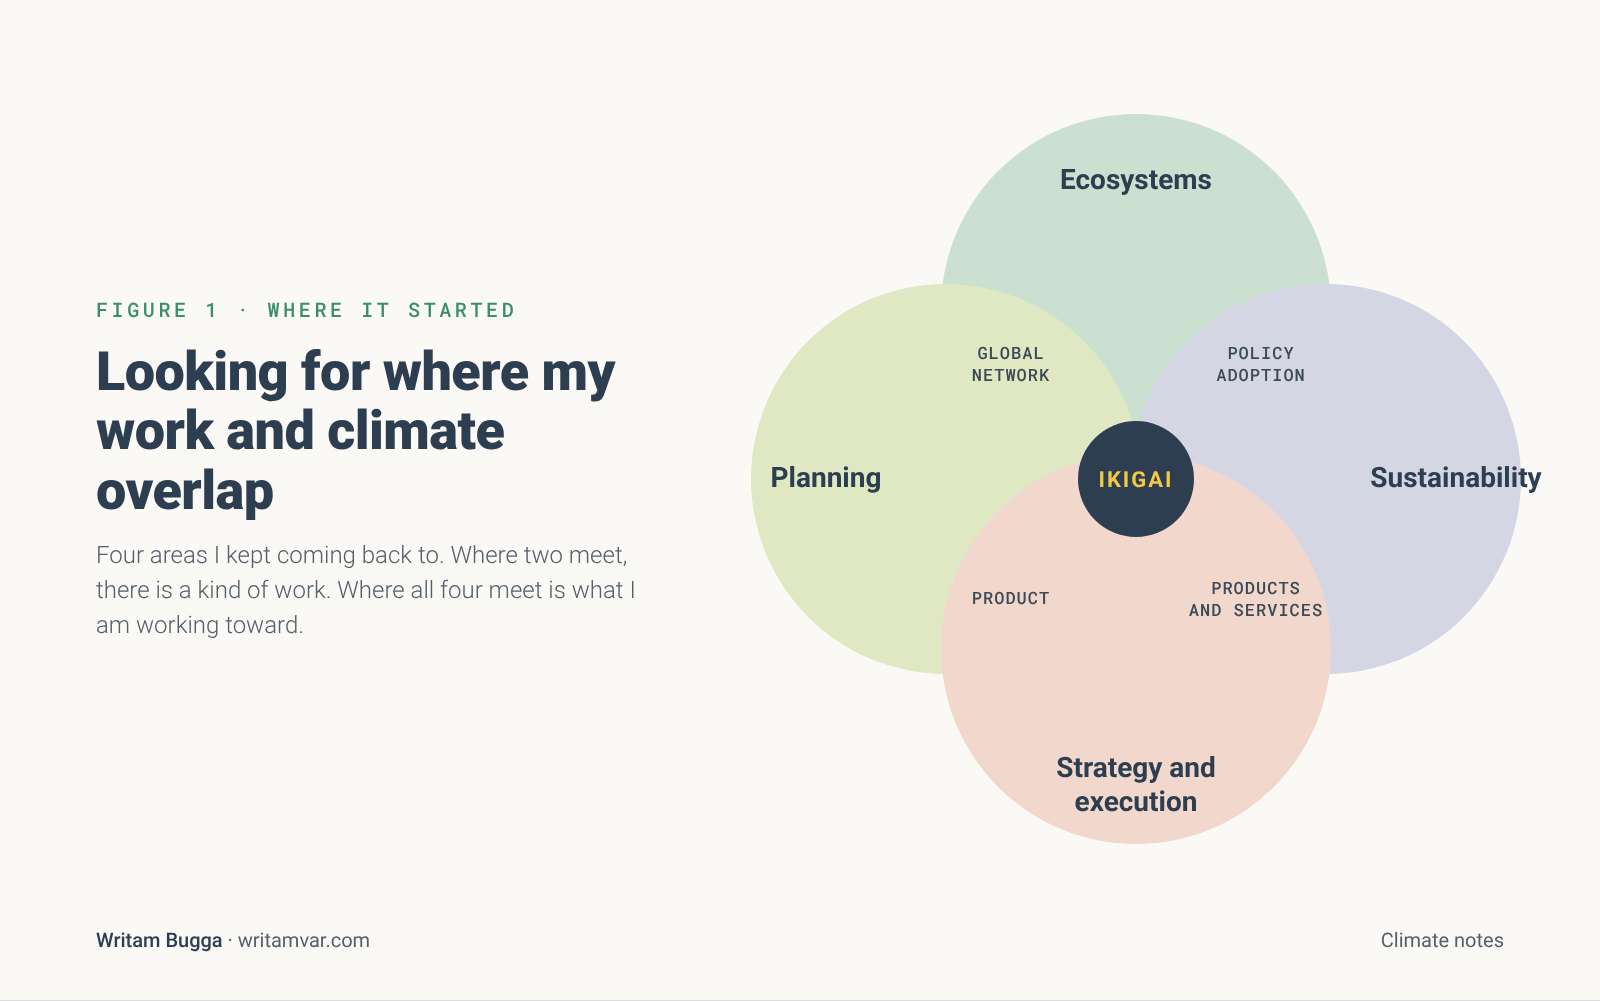
It began with an Ikigai exercise: what I love, what I am good at, what the world needs and what I can be paid for. The overlap pointed to sustainable products.
The problem was credibility
Every product claim led to the same questions. Which certifications count? Which manufacturers are certified? Where does the supplier data live, and does the source comply with any standard? Most of the time, the data did not exist.
I kept asking why
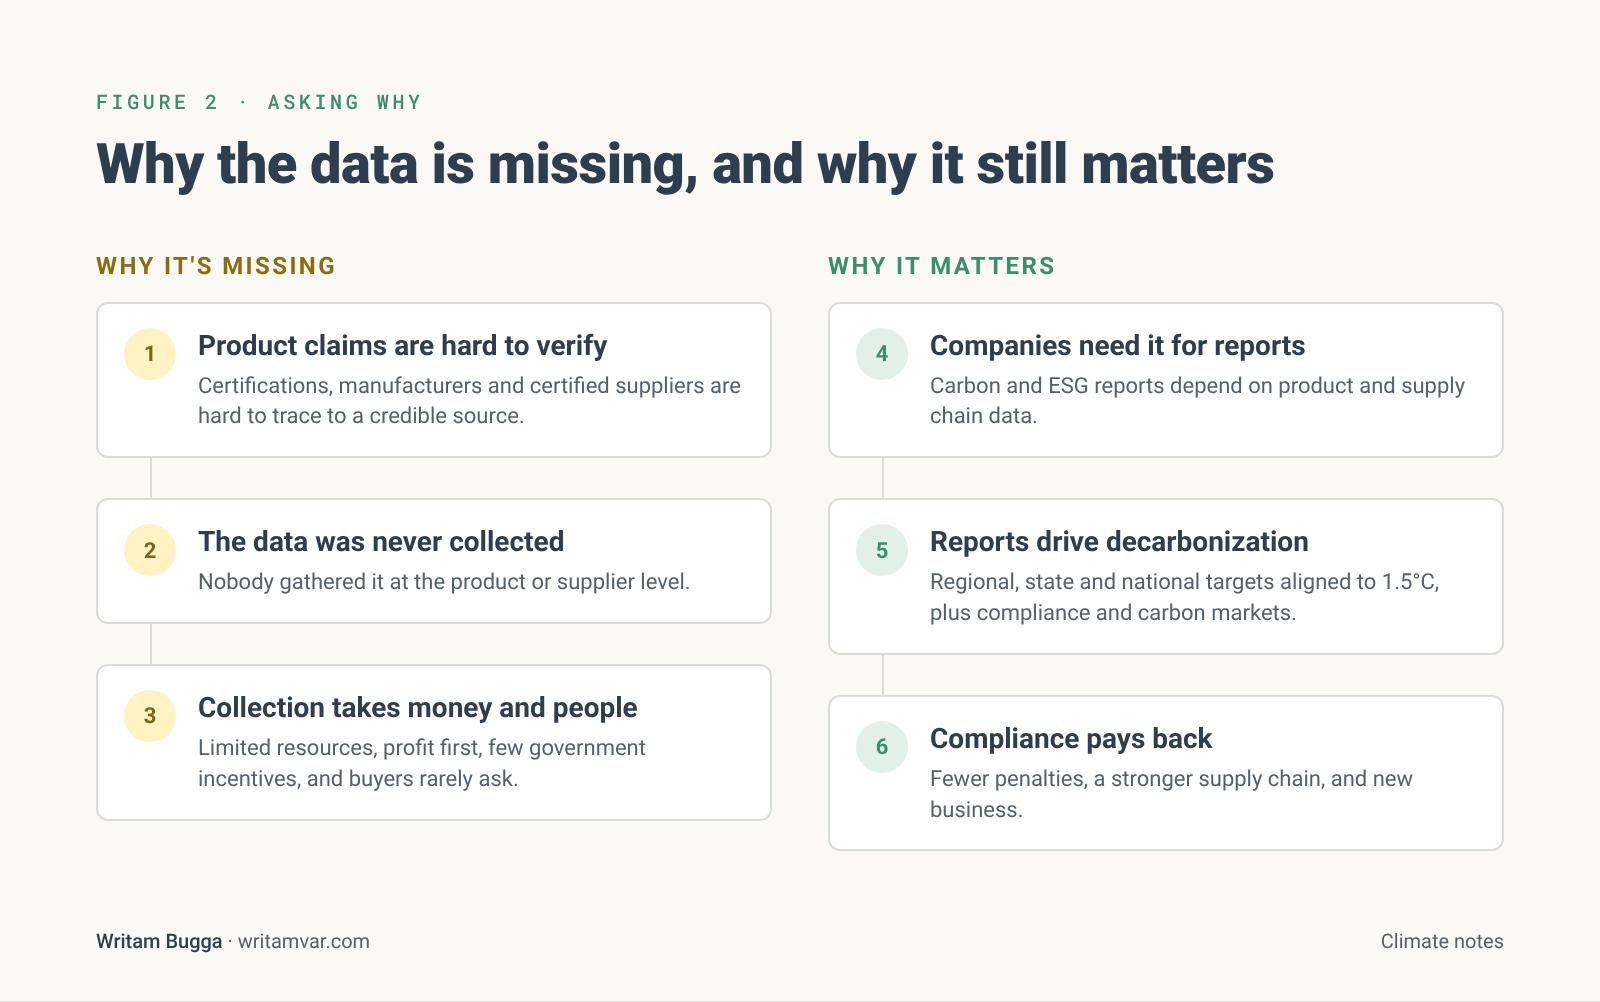
The data does not exist because nobody collected it. Collecting it takes money and people. Profit usually comes first, governments offer few incentives and buyers rarely ask for it.
Companies still need it. Carbon and ESG reports depend on product and supply chain data. Those reports support decarbonization plans tied to 1.5°C targets at regional, state and national levels, along with compliance and, in some cases, carbon markets. Compliance pays back through fewer penalties, a stronger supply chain and new business.
Where EPDs come in
Environmental product declarations document the lifecycle footprint of a product, like a steel beam, a window unit or a bag of cement. If you do business in the EU or U.S., especially in construction, they increasingly decide whether your product is even in the conversation. Databases like EC3 collect them for buyers.
An EPD is built on a life cycle assessment. That makes the LCA the place where product-level carbon data gets made.
How carbon data gets built
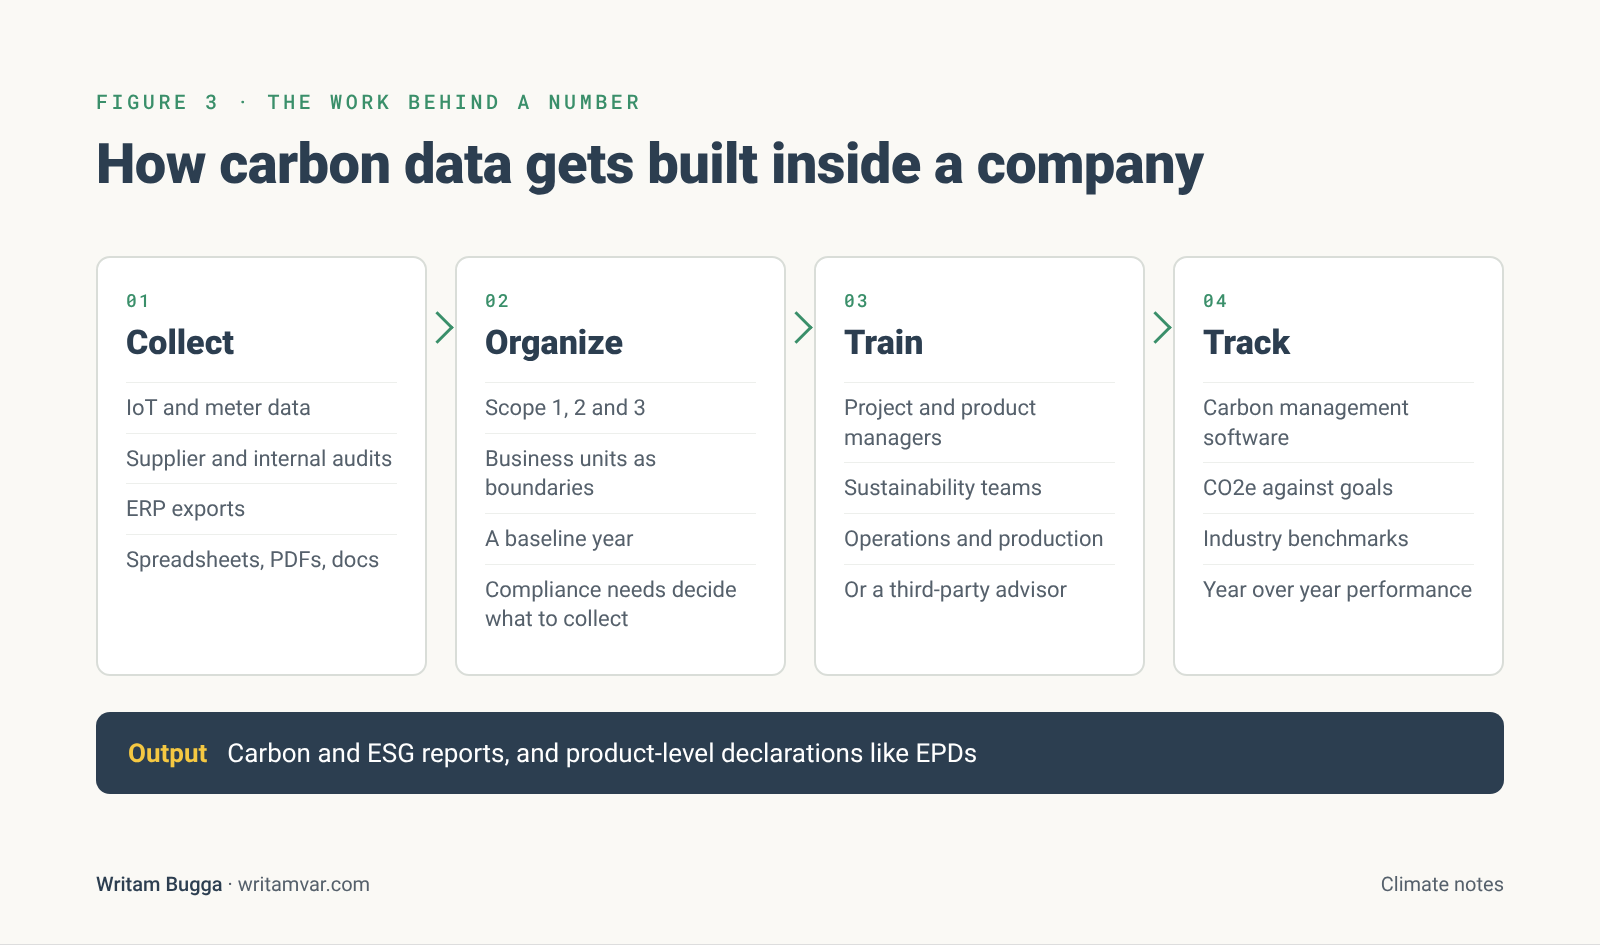
Behind every reported number is plain operational work. I broke it into four stages.
- Collect: IoT and meter data, supplier and internal audits, ERP exports, and many spreadsheets, PDFs and documents. Compliance requirements and operations decide what to collect.
- Organize: Scope 1, 2 and 3 emissions under the GHG Protocol, business units as boundaries (each with its own P&L), and a baseline year.
- Train: project managers, product managers, sustainability teams, operations and production. The alternative is a carbon management service or a sustainability advisor.
- Track: carbon management software, CO2e against business and sustainability goals, and benchmarks from industry standards.
The footprint of AI
I also looked at the systems I work with every day. AI development has its own footprint in carbon, water and waste, including end-of-life IT equipment. Training and inference have different profiles. Data center PUE, the number and type of GPUs, how much they are used and the grid behind them all matter. I wrote about measuring this in how to measure software carbon intensity for AI.
The system in one picture
While learning, I kept thinking about the products, services and stakeholders that make up the ecosystem. Mapping it showed me where a product could fit.
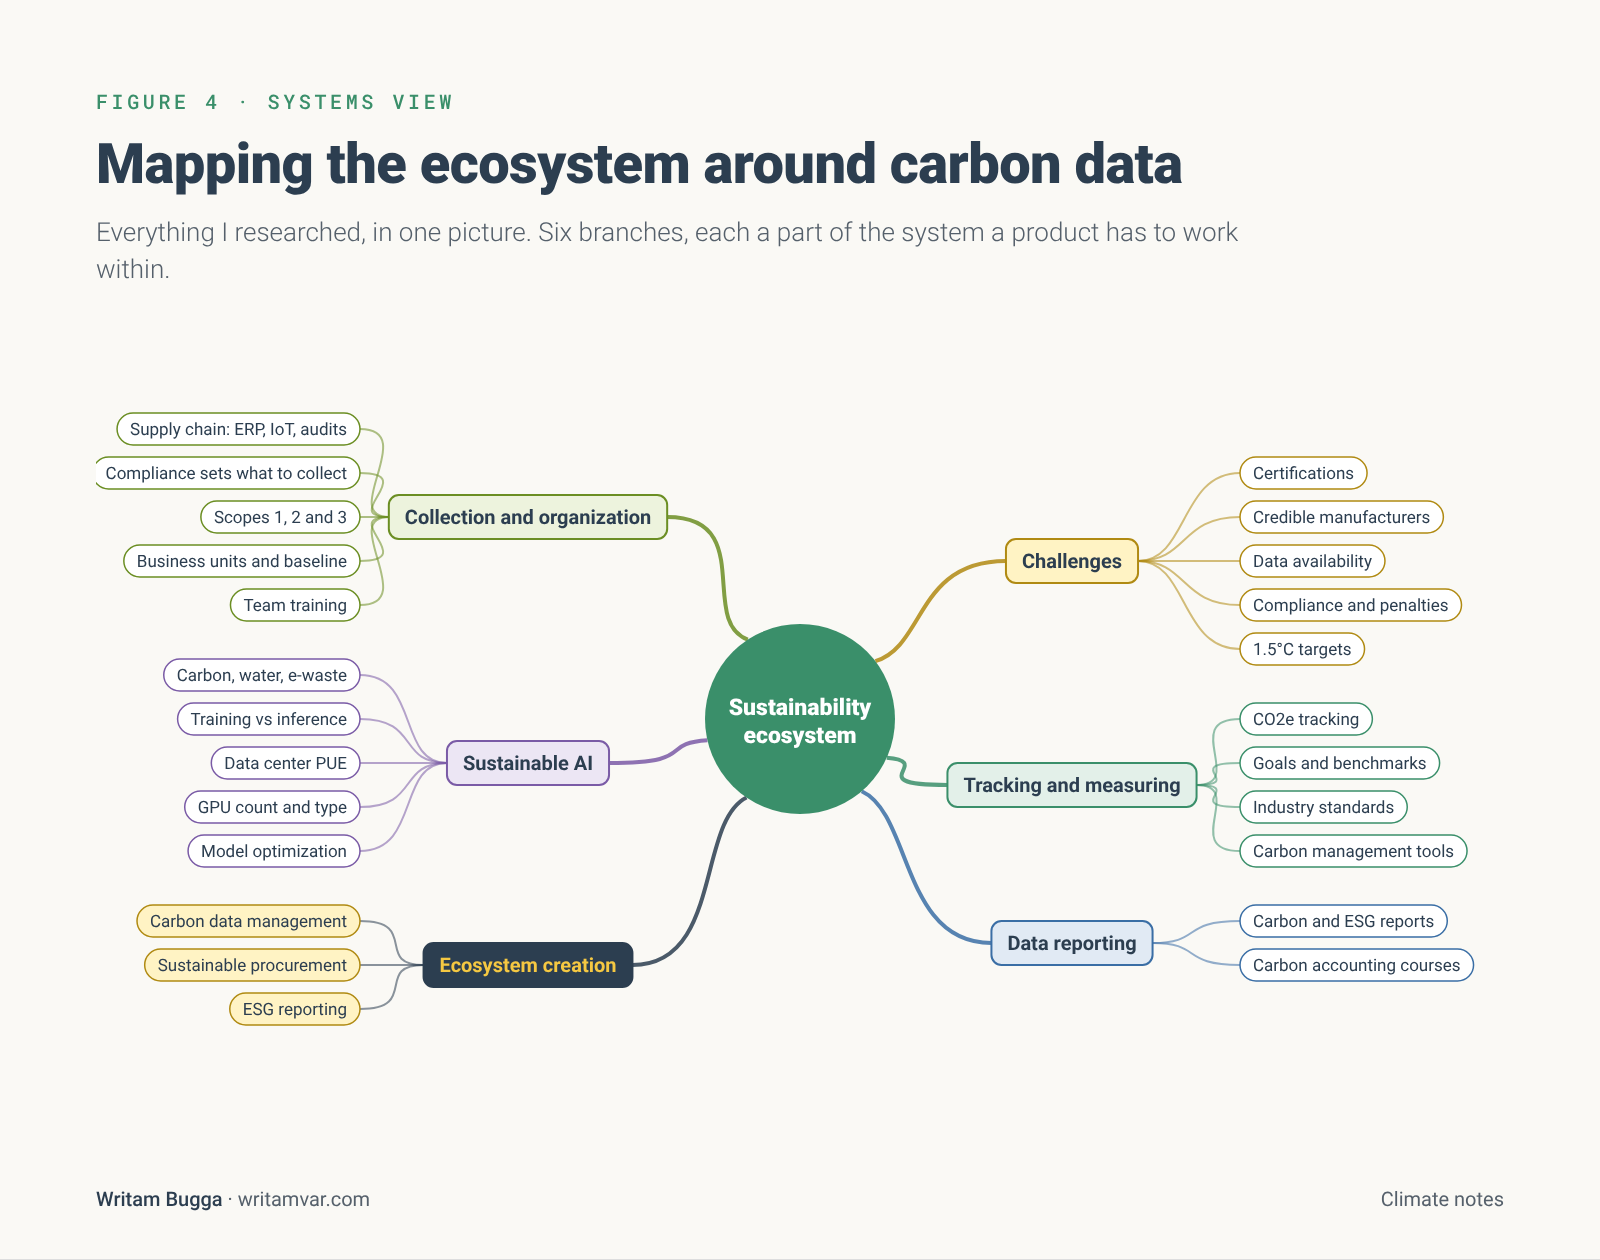
Three goals came out of it: support carbon data collection and management, enable sustainable procurement and emissions improvement, and support ESG reporting.
What I built
Discovery kept pointing back to one thing: the data was not there. So in mid-2025 I rebuilt the marketplace idea around LCA instead. In the concept, an LCA consultant enters their role, sector and use case, uploads the information they already have, and gets a Climate Action Profile back as a starting point for an action plan. You can see it at decarbonize.digital.
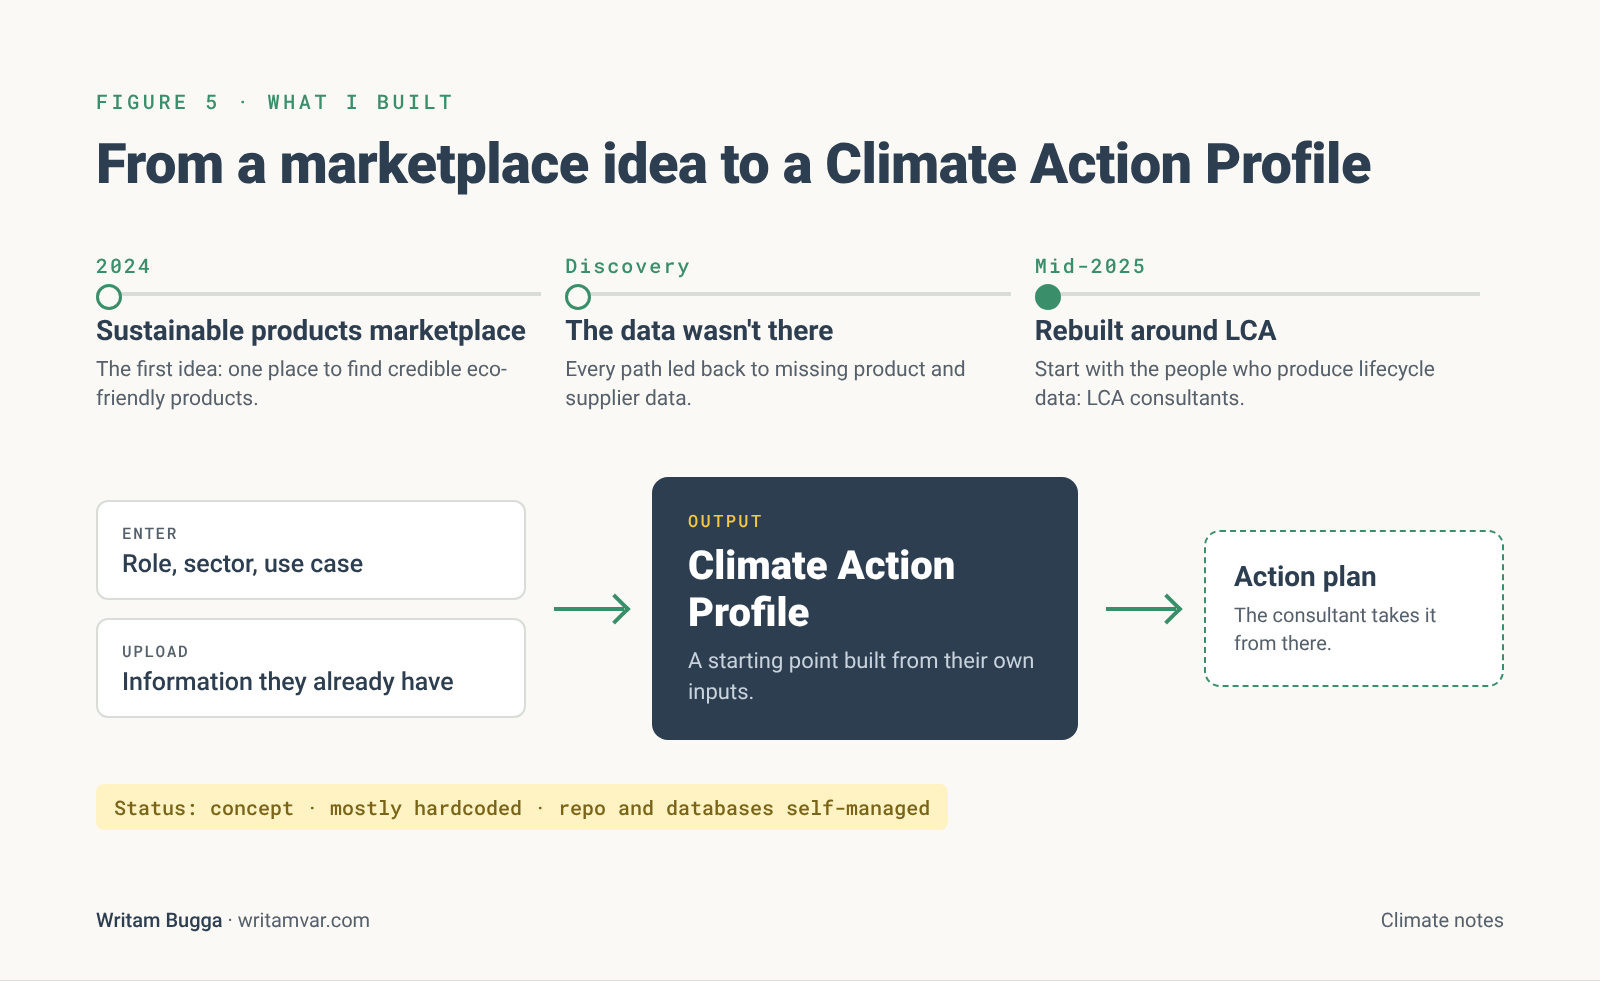
It is a concept. Most of it is hardcoded right now. I manage the repo and the databases myself, so I know exactly how far it is from production.
What I want to work on
The data layer behind carbon accounting, sustainable procurement and ESG reporting. If you work on EPDs, LCA or carbon data, I would like to hear what slows you down most. You can reach me on LinkedIn or through my Personal Website.
More in The Data Gap
Notes on EPD platforms and machine-readable declarations
A market reading of digital EPD infrastructure: why moving declarations from PDFs to structured data matters, and where product opportunities sit.
The SMB carbon advantage
Most carbon tools are built for enterprises, but small and medium businesses carry much of the supply chain. Why that gap matters, and what tools could do.
Why LCA and ESG need each other
ESG reports describe a company. LCAs describe a product. As reporting gets more product-specific, the two are converging, and that is where the data gap shows.